Solving linear Programming Problems with the help of graph
Problem 1
Solve the following linear programming problem graphically:
Maximize Z = 4x + y ... (1)
subject to the constraints:
x + y ≤ 50 ....(2)
3x + y ≤ 90 ... (3)
x ≥ 0, y ≥ 0 ... (4)
Solution -
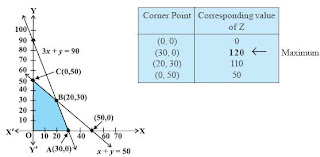
The shaded region in the below figure helps to understand graphical feasible region determined by the system
of constraints (2) to (4). We observe that the feasible region OABC is bounded. So,
we now use Corner Point Method to determine the maximum value of Z.
The coordinates of the corner points O, A, B and C are (0, 0), (30, 0), (20, 30) and
(0, 50) respectively. Now we evaluate Z at each corner point.

--> Problem 1
Solve the following linear programming problem graphically:
Maximize Z = 4x + y ... (1)
subject to the constraints:
x + y ≤ 50 ....(2)
3x + y ≤ 90 ... (3)
x ≥ 0, y ≥ 0 ... (4)
Solution -
The shaded region in the below figure helps to understand graphical feasible region determined by the system
of constraints (2) to (4). We observe that the feasible region OABC is bounded. So,
we now use Corner Point Method to determine the maximum value of Z.
The coordinates of the corner points O, A, B and C are (0, 0), (30, 0), (20, 30) and
(0, 50) respectively. Now we evaluate Z at each corner point.

This is how you understand how to solve Linear Programming Problems